Young people's cancers survival statistics

Survival

Survive young people's cancers for 5 or more years, 2012-16, UK

Improvement

Young people's cancers survival in the UK has increased in the last 10 years


87% of people diagnosed with cancer at ages 15-24 in the UK are predicted to survive for at least five years, as shown by population-based survival for patients diagnosed in 2012-2016.[1] This falls to 83% surviving for at least 10 years, for people diagnosed in 2007-2011.

Survival among people diagnosed with cancer at ages 15-24 continues to fall beyond ten years after diagnosis. 79% of people diagnosed in 2002-2006 survived for 15 years or more, and 74% of those diagnosed in 1997-2001 survived for at least 20 years.[1]

Young People’s Cancers, Five-, Ten-, Fifteen-, and Twenty-Year Population-Based Survival, Ages 15-24, UK, 1997-2016

References

  1. National Cancer Registration and Analysis Service. Children, teenagers and young adults UK cancer statistics report 2021. Available from http://ncin.org.uk/cancer_type_and_topic_specific_work/cancer_type_specific_work/cancer_in_children_teenagers_and_young_adults/. Accessed April 2021.

About this data

Data is for UK, 1997-2016, International Classification of Childhood Cancer, Third Edition (ICCC-3).

Survival statistics give an overall picture of survival and the survival time experienced by an individual patient may be much higher or lower, depending on specific patient and tumour characteristics.

Last reviewed:

As with most cancers, survival for young people’s cancers is improving. Five-year population-based survival for young people’s cancers in the UK increased from 79% in 1997-2001 to 87% in 2012-2016.[1]

Ten-year population-based survival for young people’s cancers in the UK increased from 76% in 1997-2001 to 83% in 2007-2011.[1]

Young People’s Cancers, Five- and Ten-Year Population-Based Survival, Ages 15-24, UK, 1997-2001 to 2012-2016

References

  1. National Cancer Registration and Analysis Service. Children, teenagers and young adults UK cancer statistics report 2021. Available from http://ncin.org.uk/cancer_type_and_topic_specific_work/cancer_type_specific_work/cancer_in_children_teenagers_and_young_adults/. Accessed April 2021.

About this data

Data is for UK, 1997-2016, International Classification of Childhood Cancer, Third Edition (ICCC-3)

Survival statistics give an overall picture of survival and the survival time experienced by an individual patient may be much higher or lower, depending on specific patient and tumour characteristics.
Last reviewed:

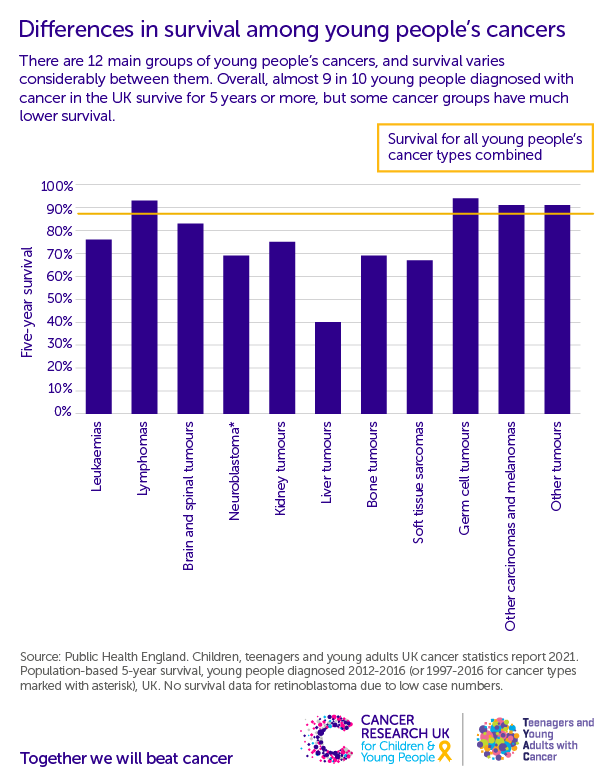
Survival for young people’s cancers varies considerably between diagnostic groups.[1

Young People’s Cancers By Diagnostic Group, Population-Based Five-Year Survival, Ages 15-24, UK, 2012-2016

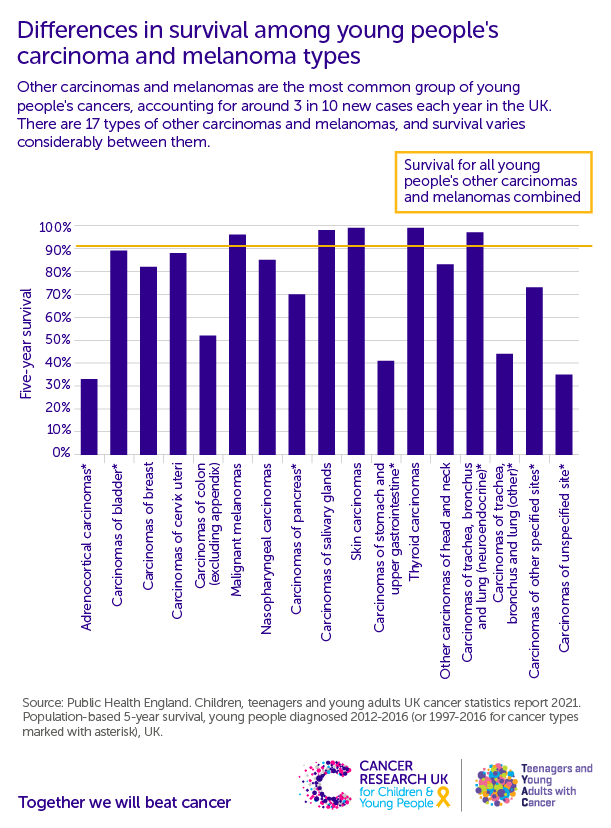
There is also marked variation within these broad diagnostic groups.[1]

Young People’s Carcinomas and Melanomas By Diagnostic Subgroup, Population-Based Five-Year Survival, Ages 15-24, UK, 2012-2016

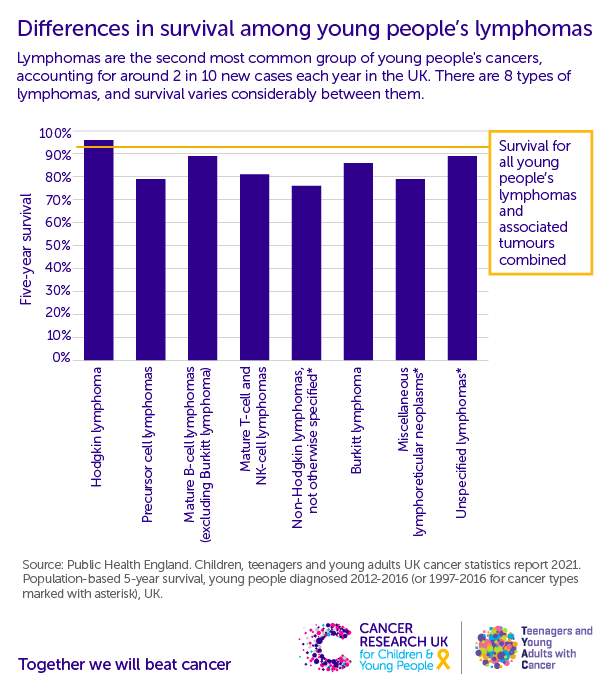
Young People’s Lymphomas By Diagnostic Subgroup, Population-Based Five-Year Survival, Ages 15-24, UK, 2012-2016

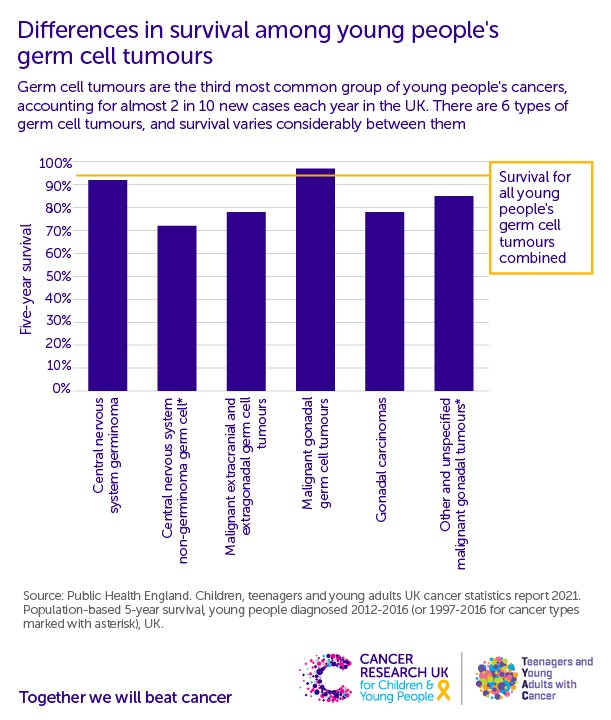
Young People’s Germ Cell Tumours By Diagnostic Subgroup, Population-Based Five-Year Survival, Ages 15-24, UK, 2012-2016

Survival has increased for some diagnostic groups since the 1990s, but by varying amounts and at different points in time.[1] Survival has not improved significantly for neuroblastomas, kidney tumours, liver tumours, or other and unspecified tumours in this period.

Young People’s Cancers by Diagnostic Group, Population-Based Five-Year Survival, Ages 15-24, UK, 1997-2001 to 2012-2016

References

1. National Cancer Registration and Analysis Service. Children, teenagers and young adults UK cancer statistics report 2021. Available from http://ncin.org.uk/cancer_type_and_topic_specific_work/cancer_type_specific_work/cancer_in_children_teenagers_and_young_adults/. Accessed April 2021.

About this data

Data is for UK, 1997-2016, International Classification of Childhood Cancer, Third Edition (ICCC-3).
Survival statistics give an overall picture of survival and the survival time experienced by an individual patient may be much higher or lower, depending on specific patient and tumour characteristics.
Last reviewed:

In a European registry study, the five-year survival rate for young people with all cancers (excluding non-melanoma skin cancer) in 23 European countries in 2000-2002 was 87%.[1] The survival rate was lower in males than females, and was generally highest in the Northern European countries studied, and lowest in the Eastern European countries. Five-year survival ranged from 84% in Northern Ireland to 92% in Iceland, although neither rates were significantly different from the European average. In contrast, the overall five-year survival rate for England, while slightly higher than that for Northern Ireland, was significantly lower than the European average.[1]

References

  1. Gatta G, Zigon G, Capocaccia R, et al. Survival of European children and young adults with cancer diagnosed 1995-2002. Eur J Cancer 2009 45:992-1005.

About this data

See source for ICD codes and other data specifics.

Last reviewed:

Cancer stats explained

See information and explanations on terminology used for statistics and reporting of cancer, and the methods used to calculate some of our statistics.

Citation

You are welcome to reuse this Cancer Research UK content for your own work.
Credit us as authors by referencing Cancer Research UK as the primary source. Suggested styles are:

Web content: Cancer Research UK, full URL of the page, Accessed [month] [year].
Publications: Cancer Research UK ([year of publication]), Name of publication, Cancer Research UK.
Graphics (when reused unaltered): Credit: Cancer Research UK.
Graphics (when recreated with differences): Based on a graphic created by Cancer Research UK.

When Cancer Research UK material is used for commercial reasons, we encourage a donation to our life-saving research.
Send a cheque payable to Cancer Research UK to: Cancer Research UK, 2 Redman Place, London, E20 1JQ or

Donate online

Acknowledgements

We are grateful to the many organisations across the UK which collect, analyse, and share the data which we use, and to the patients and public who consent for their data to be used. Find out more about the sources which are essential for our statistics.