Last reviewed: 15 July 2025
Last reviewed: 15 July 2025

Analysis
This analysis, conducted in partnership with the National Disease Registration Service, part of NHS England, looks at performance grouped by the two FDS outcomes. FDS performance, median waiting length and proportion waiting each week post-referral were analysed along with results for the different suspected cancer sites/groups.
Faster Diagnosis Standard: Variation in performance on the Faster Diagnosis pathway. Analysis of referrals leading to a diagnosis, or a ruling out, of cancer.(PDF, 4.13 MB) September 2025
Report
A study published in The Lancet Regional Health – Europe analysed how cancer survival has changed over nearly 50 years in England and Wales. It found that 10-year survival for all cancers combined has doubled, from 24% in 1971-72 to 50% in 2018. Men have seen greater improvements in survival than women since the 1970s, but survival remains higher in women.
Read the Long-term trends in cancer survival in England and Wales paper. September 2025
Analysis brief
The study shows that the expected loss in future productivity due to cancer deaths in 2023 is £10.27bn. This lost productivity is the result of 350,000 fewer years expected to be worked, highlighting that cancer has the largest impact on productivity due to premature mortality of any other cause of death.
Read in full - Economic losses due to cancer mortality(PDF, 1.17 MB)June 2025

Report
This report sets out the key challenges facing cancer services and people affected by cancer in the UK today. It shows that improvements can be made across the cancer pathway – preventing cancers, diagnosing patients earlier and ensuring patients have access to the best treatment options.
Read the 2025 overview of cancer in the UK(PDF, 6.18 MB) February 2025
Analysis brief
This report examines the relationship between deprivation and cancer mortality in the UK and its constituent countries. All analyses were completed within each country separately and then summed to UK totals. The report finds cancer...
Read the UK Cancer Mortality by Deprivation analysis(PDF, 300 KB) February 2025

Analysis brief
Almost 300,000 cancer cases are projected to be caused by smoking in the current parliamentary term in the UK. Around 2,800 of these cases are expected to be caused by secondhand smoke exposure in people who have never smoked.
Read the full Projected UK cancer cases caused by tobacco report(PDF, 492 KB) November 2024

Report
This report updates the Cancer in the UK 2020: socioeconomic Deprivation report and highlights ongoing disparities between the most and least deprived groups.
Read the full Socioeconomic Deprivation Report(PDF, 1.6 MB) February 2025

Report
This report sets out the key challenges facing cancer services and people affected by cancer. We’ve made huge progress on cancer in the last 50 years, but new analysis indicates that improvements in survival have slowed.
View the full 2024 Cancer in the UK report(PDF, 2.53 MB) February 2024

Report
This summary provides an overview of key metrics and data across the cancer pathway in Scotland, as part of the Cancer in the UK: Overview 2024 report, which provides the full UK picture. It looks at where progress is being made and what challenges remain in Scotland.
Read the full Scotland Cancer in the UK report(PDF, 228 KB) February 2024
Report
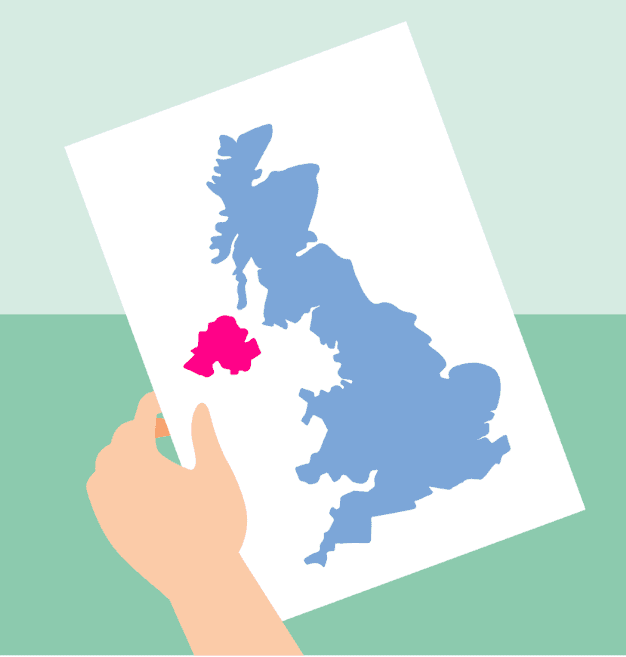
This summary provides an overview of key metrics and data across the cancer pathway in Northern Ireland, as part of the Cancer in the UK: Overview 2024 report, which provides the full UK picture. It looks at where progress is being made and what challenges remain in Northern Ireland.
View the Northern Ireland Cancer in the UK report(PDF, 1.15 MB) February 2024
Report
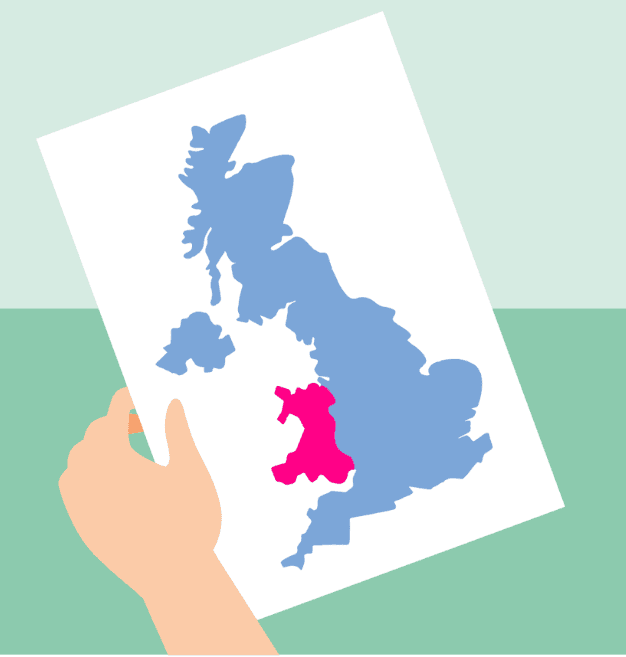
This summary provides an overview of key metrics and data across the cancer pathway in Wales, as part of the Cancer in the UK: Overview 2024 report, which provides the full UK picture. It looks at where progress is being made and what challenges remain in Wales.
View the 2024 Cancer in the UK Wales overview(PDF, 658 KB) February 2024

Report
This report focuses on the impact of deprivation across the cancer pathway in Scotland. Generally, populations with higher deprivation have greater risk factors for cancer, are less aware of symptoms of cancer and report more barriers to seeking help.
Read the full Deprivation and cancer inequalities in Scotland report(PDF, 1.81 MB) November 2022
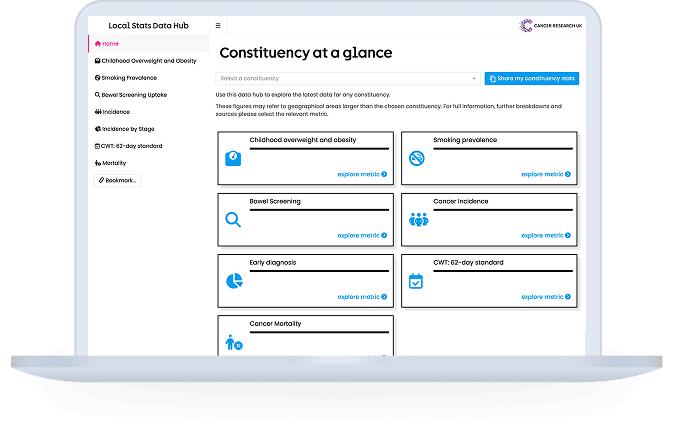
The local stats data hub gives provides information across the cancer pathway for each constituency area based on publicly available data. It includes information on smoking prevalence, childhood overweight and obesity, bowel screening, cancer waiting...
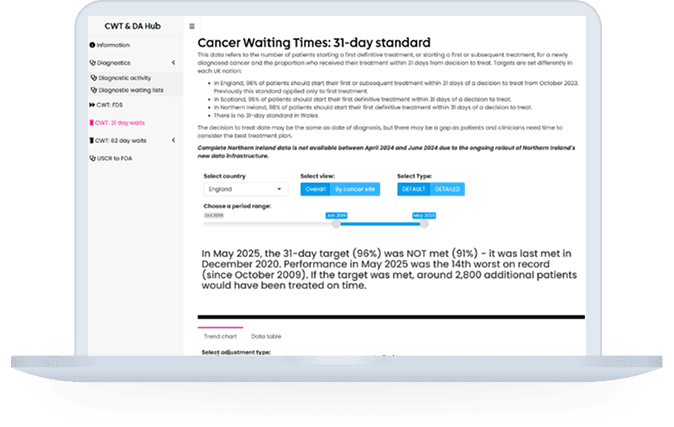
The CRUK Cancer Intelligence Team’s Cancer Waiting Times and Diagnostic Activity Data Hub gathers the latest data from across the UK on cancer waiting times performance and diagnostic activity and waiting times. You can view breakdowns for some of this ...
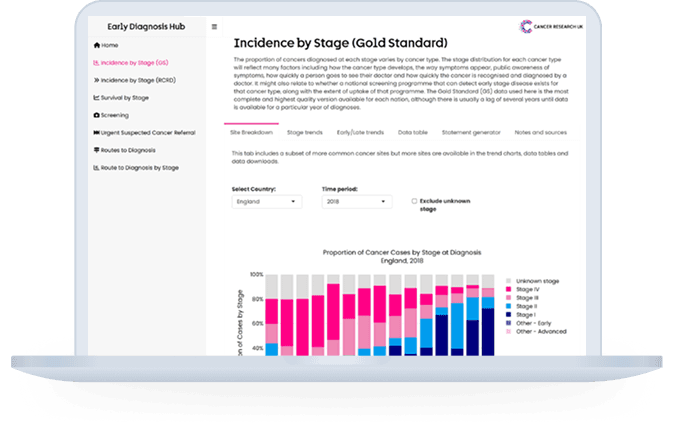
The CRUK Cancer Intelligence Team’s Early Diagnosis Data Hub gathers information and statistics across a number of cancer early diagnosis measures including incidence and survival by stage at diagnosis, screening uptake, ...
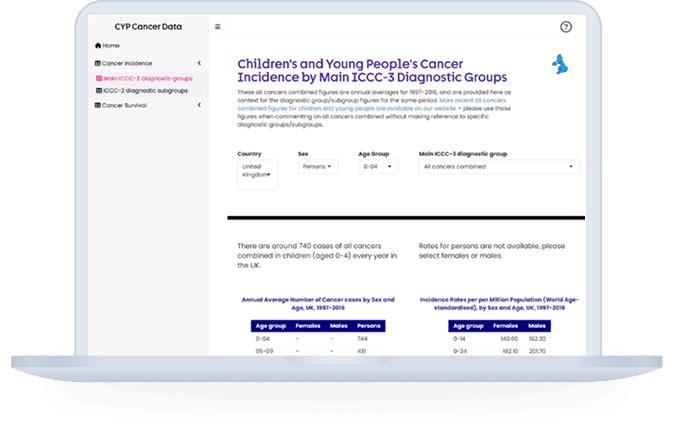
The CRUK Cancer Intelligence Team’s Children and Young People Cancer data hub uses data from Public Health England to provide a dashboard for cancer incidence and survival for 0–24-year-olds in the UK and its constituent nations...
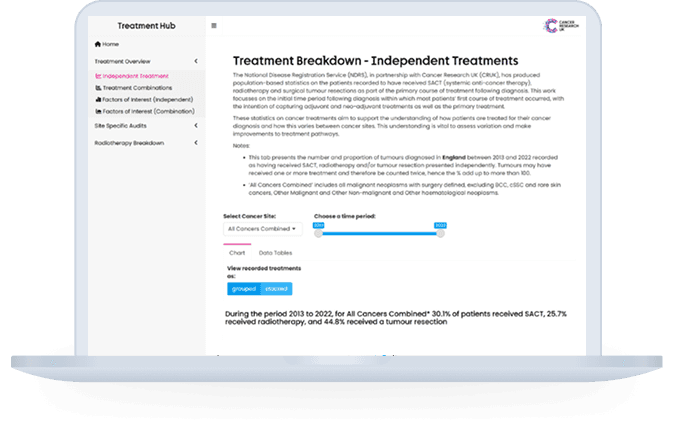
The CRUK Cancer Intelligence Team’s Treatment Data hub gathers information and statistics across a number of cancer treatment measures, including proportions of treatments given over time and detailed data on radiotherapy delivery...
Archived reports and supplementary analyses to view earlier reports and the supplementary analyses for our reports
Prevention Policy Research to view our policy on different ways of preventing cancer
Cancer Awareness Measure ‘Plus’ (CAM+) to view a regularly updated survey that collects data on the UK public’s attitudes, awareness and behaviours across key topics
If you have any questions on this page please reach out to the Cancer Intelligence team.
Stay up-to-date with the latest cancer research information.